

How to choose a proper spectrometer for your application?
Selecting a spectrometer is a critical decision-making process that requires careful consideration of multiple factors to ensure the instrument meets specific application requirements. There are some technical parameters that need to considerate to when you evaluate the performance of a spectrometer.
Wavelength range — which part of the spectrum do you need in your application?
The spectral range defines the wavelength span a spectrometer can measure. Typical ranges are 200-400 nm for UV, 350-800 nm for visible light, and 750-1700 nm for near-infrared.
Wavelength accuracy — how close the measured wavelength is to its true value?
Wavelength accuracy reflects the match between displayed and actual wavelengths. Accuracy is calculated by measuring peak wavelengths of spectral lines from an element lamp, taking five evenly spaced reference peaks, and comparing measured to reference values:
ΔWi = | Wi – Ws |,
Where △Wi is wavelength accuracy for band i, Wi is measured peak wavelength, and Ws is reference wavelength.
Spectral resolution — how close two wavelengths can be and still be distinguished?
Spectral resolution is the smallest wavelength difference a spectrometer can distinguish, indicating its ability to separate wavelengths. Higher resolution enhances performance, especially for hyperspectral imaging, which requires hundreds of narrow bands.
To evaluate, measure 5 evenly spaced spectral lines, adjusting integration time to reach 85% ±5% of saturation. Repeat FWHM measurements 5 times after dark noise removal. If spectral points are insufficient, use Lorentzian fitting to calculate FWHM.
R = λ/Δλ
where Δλ is the minimum resolvable wavelength difference.
Dynamic range — what is the span between the weakest and strongest signals the detector can measure at the same time?
Dynamic range is the ratio of maximum measurable signal (saturation) to the minimum detectable signal (noise), enhancing signal stability and spectral range. It is calculated as: Dynamic Range = Saturation Signal / RMS of Dark Noise.
Signal-to-noise ratio (SNR) — how strong is the real signal compared to random background noise?
SNR is the ratio of signal strength to noise level; higher SNR indicates greater measurement accuracy. SNR is calculated with 100 scans in both dark and illuminated conditions as:
SNRρ = (S-D)/ σρ
where SNRρ is average illuminated signal, D is average dark signal, σρ is sample standard deviation.
The VL-SpecBase116 achieves 85% quantum efficiency, significantly enhancing detection performance in the UV and near-IR regions.( High SRN High Sensitivity Wide Dynamic Range)
Dark noise — what the electronic noise is present even when no light hits the detector?
Dark noise is background signal noise in the absence of light, from electronic, cosmic, and thermal sources. Reducing dark noise improves SNR. Dark noise baseline is measured at minimum integration time.
BL = S̄
Where: BL is dark noise baseline, S̄ is mean dark noise for a single spectrum frame.
Stray light —how much the unwanted light scattered inside the spectrometer reaches the detector?
Stray light refers to unwanted wavelengths detected outside the target range, affecting monochromatic accuracy and increasing measurement errors. Lower stray light enhances measurement precision. The HS2048 features an optimized optical design with high-quality components and advanced stray light suppression, reducing stray light to below 0.1% and enhancing spectral purity and detection accuracy.
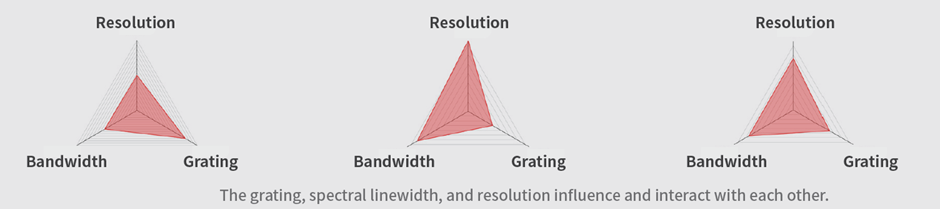
Spectral resolution and bandwidth are linked to the way a diffraction grating spreads light, so they can’t both be pushed to the extreme at once. Grating parameters that increase resolution (high groove density, long focal length, narrow slit) inherently reduce the measurable bandwidth, while parameters that widen bandwidth reduce resolution. Designing a spectrometer always means finding the balance that fits the application.
There are some important things you need to considerate when you choose a spectrometer:
Applications Field: Identify the primary application (e.g., chemical analysis, material testing, biomedical research, environmental monitoring).
Sample Type: Determine the sample type (gas, liquid, solid) and if preprocessing is required.
Measurement Goal: Specify if quantitative, qualitative, or both are needed.
Spectral Resolution: Select resolution based on FWHM; higher resolution is for applications needing precise spectral separation. The HS4096 offers outstanding resolution, precisely capturing subtle spectral changes, making it ideal for high-precision spectral analysis.
Grating : High-density gratings improve resolution but may limit range; balance range and resolution.
Sensitivity: Assess the need for detecting low concentrations or trace samples.
Detection Limit: Ensure it aligns with the required concentration range for accurate measurements.
Grating Density: Choose density for desired dispersion and resolution.
Optical Design: Consider the impact of lenses, fibers, and light paths on performance and stability.
Software Features: Ensure software includes data acquisition, analysis, and reporting tools.
Data Interface: Confirm compatibility of data output options (e.g., USB, Ethernet) with other equipment. The Gino features a built-in operating system, storage, and display, allowing for standalone operation without the need for a computer. (IoT Design Ethernet data transmission)
Temperature Control: Some spectrometers require stable environments or cooling for consistent performance. The TEC2000 features a low-noise, cooling-enhanced back-illuminated detector, ensuring reliable long-term performance and making it ideal for extended integration applications. DQPlus features an 18-bit A/D sampling design and deep cooling, achieving a dynamic range of ~38,000:1 with the capability for 15-minute continuous operation.
Maintenance: Choose equipment with minimal maintenance and easy calibration.
Instrument Size: Ensure it fits the available lab space. The Cora is designed for portability with a lightweight and slim structure, making it ideal for integration into handheld devices.
Compatibility: Verify compatibility with existing lab equipment, like sample handling systems and computers.
We usually follow this flow to choose a proper spectrometer for your application.
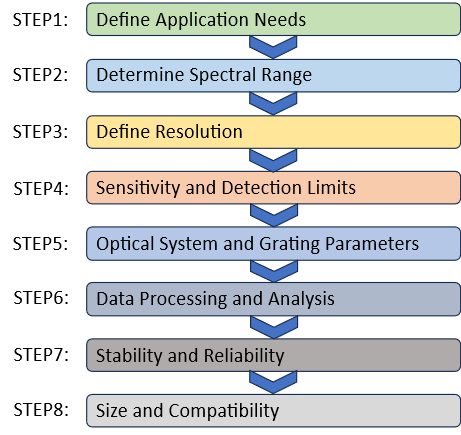
Spectrometer selection flow
Tell us more about your applications and needs using this link, and we’ll assist you whenever it’s most convenient for you.

